

In the dynamic world of finance, swing trading has emerged
as a popular trading strategy that aims to capture short-term price movements
in stocks. Unlike long-term investors who patiently hold onto stocks for years,
swing traders seek to capitalize on the market's shorter-term fluctuations,
aiming to profit from both upward and downward price movements.
However, swing trading requires a well-defined approach to stock selection, as
making informed decisions is crucial. The art of
stock selection involves identifying stocks with high profit potential while
effectively managing risk. In this blog, we will discuss how to select stocks
for swing trading that can help aspiring swing traders to get better results.
Sector Identification :
We
need to have a top-down approach in identifying strong sector. For swing trading purpose need to find the outperforming
sector first and foremost and then select the strongest stock from the outperforming sector. Stocks tend to move in line with their sector.
so, it's beneficial to trade stocks within a strong sector.
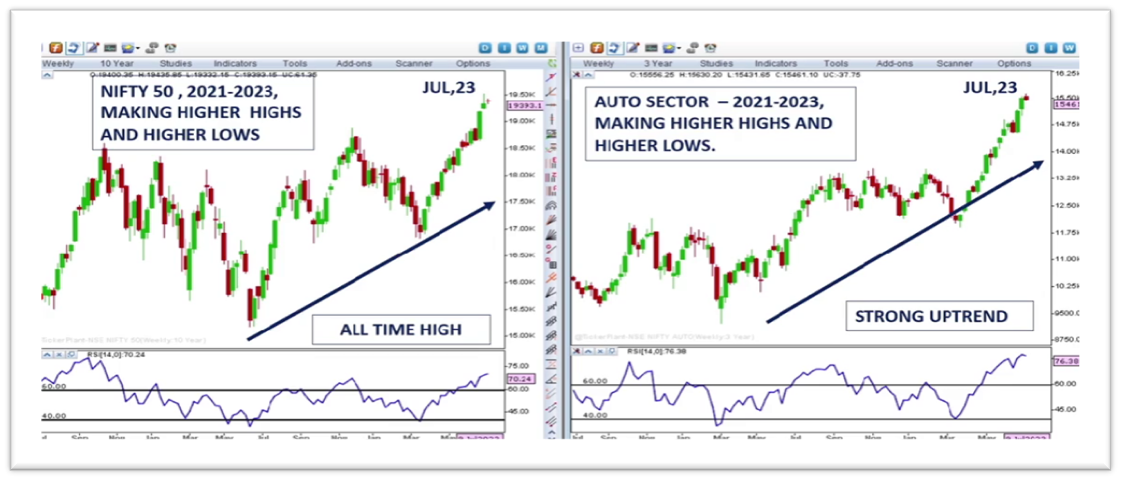
How to identify Outperforming sector?
We need to have a thorough comparison of each sector index with benchmark Index like Nifty-50 and Sensex. Here in below example showing comparison of Nifty index with auto index as Auto index have been outperforming other sector in recent times.
What is Swing Trading?
Swing trading is type of trading where the traders try to
capture short to medium term price momentum in particular Stocks. Swing trading
time duration can be few days to few weeks depending on the momentum in the stocks
a trader looks to capture.
When we talk about swing trading, it's important to focus on stocks that have strong potential and strong momentum for price movements in short term. Let’s discuss some important factors to consider when selecting stocks for swing trading:
- Price
- Pattern
- Volume
- Momentum
- Volatility
- Market sentiments
Price Action - it is very very important and critical to understand price action of any stock before we think of trading.
Types of Trends - There can be only three trends in market.
- Uptrend
- Downtrends
- Sideways trend

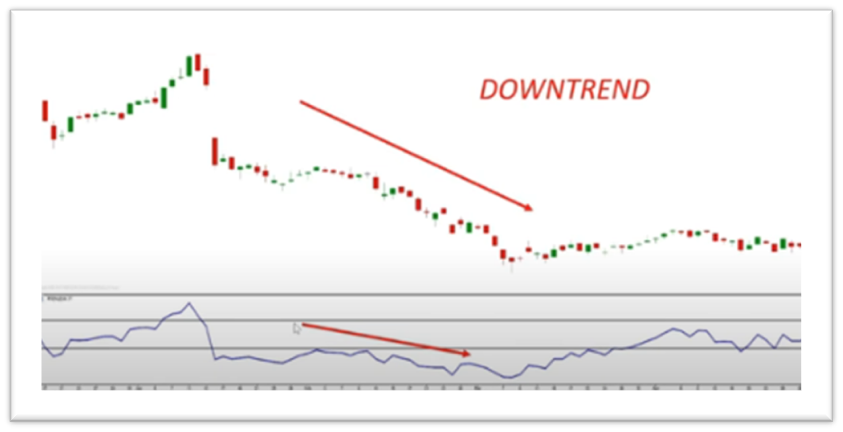
Downtrend -When the price formation is lower top ,lower bottom then we call it as downtrend.

Sideways Trend:

Support and resistance:
Support - support is a point where price takes support again and again and bounce back from there, also called as demand zone as buyers start buying at this price.
Check below image marked with arrow to understand the support zone from where price takes support and bounce back upwards.

Change in Polarity - When the resistance become support then we call it change in polarity.

Patterns - - There are different types of pattern formed with price action. Few popular patterns are
Double Top or M- pattern , Double Bottom also called as W- Pattern.
When price makes a Double top, trader makes sell position after confirmation and in case case of double bottom formation traders make long position only after confirmation.

Consolidation Pattern. - After a long price consolidation price either breakout or breakdown and trade can make the position accordingly.


Volume:
No of share
traded in a stock is termed as volume for the stock. It can be measured as daily, weekly and monthly
whichever chart we consider for our analysis reference. Traded volume and changes in volume is one of the most important aspect for traders as we always see the relative volume.
If a price moves with a higher volume there are high chances to sustain the trends because of the fact that higher volume is driven by big trader or big fish in the market.

Momentum : Momentum indicates the speed at which price changes happens in the stocks. There is a indicator called RSI (Relative strength index) used by trader to trade in uptrend or downtrend.
RSI (Relative Strength Index) ;
RSI (Relative strength Index) is one of popular indicator
which is also my favorite and I completely trust on RSI in my personal trades. Lets see and try to understand RSI band range with
below images;
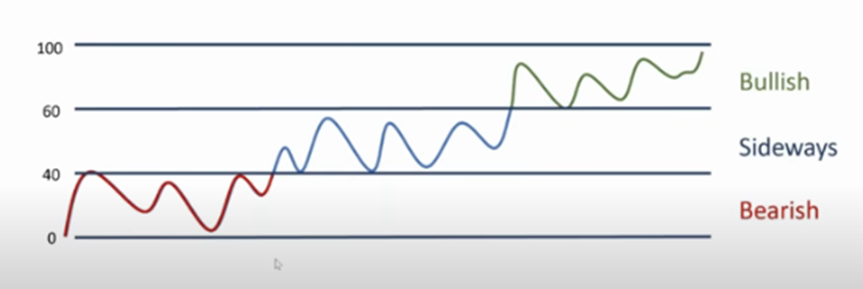
When RSI is greater than 60 ,it clearly shows the uptrend or bullish trend. lets understand it with an example here;

When RSI is between 40-60 ,it shows a sideways trend and when RSI crosses below 40 is bearish trend.
Lets see with chart examples;

Hence it it obvious that we can filter and select stocks based on RSI only to use for Swing Trading. It depends on trader which time frame they want to use.
Time Frame - Hourly & Daily is ideally suggested by experts for swing trading.
Volatility : Market volatility is measured by tool like Bollinger Band. Higher the volatility means greater chances of price movement. We only need to trade in volatile stocks as entry and exit becomes smooth.
What is Bollinger Band?
Bollinger Band consist of three lines, middle line represent the 20 day simple moving average. The upper and lower line represent the standard deviation.

When the volatility is low this means price moves sideways and band remains in a narrow range. when the volatility increases the Bollinger band squeeze opens up and its a sign of trend (uptrend /downtrend). Here Trader can plan trade as per the price action.


Market Sentiment : Overall market sentiment is define by tracking Put call ratio, India Vix and market mood which includes fear and greed.
Conclusion: In this article we learn how Price Pattern, momentum, volatility and market sentiment can impact trading. so choose your stocks wisely.Swing trading involves active monitoring and frequent trades, typically held for a few days to several weeks. It's essential to conduct thorough research, develop and own a trading system, and practice disciplined execution. Consider using a virtual trading account or paper trading to test your strategies before committing real capital.
keep reading, comment and share with your friends and family.


0 Comments